The Audio Video-game
In light of all of the analysis I tend to show here from time to time, I was recently reminded of something. When you’re using an analyzer, it’s important to understand what you’re actually seeing because not all analyzers show the same thing.
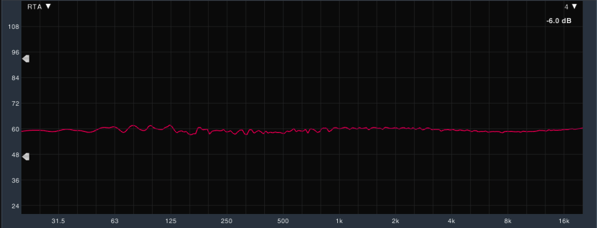
So check this out. Below you’re going to see several measurements of the exact same pink noise using a variety of real-time analyzers(RTA’s) in plug-in and software form.

Smaart v.7

Blue Cat’s Freq Analyst

fabfilter Pro-Q2

Izotope Ozone 7

Waves H-EQ
Wild, right? These are all measuring the same signal. So, which one is actually correct?
Well, all of them…sort of.
So if they’re all correct, why do they all look different?
I believe it depends on how the analyzer is designed/or not designed to deal with the logarithmic nature of our perception of sound.
From a technical perspective, the measurements that decrease in amplitude as frequency rises are more technically accurate. This is because Pink Noise is noise with equal power per octave which results in a loss of level at a rate of 3 dB per octave as the frequency increases.
So the Blue Cat and Izotope displayed here are the technically accurate measurements while the others have a tilted response. Smaart, for example, uses octave banding to display data while the FabFilter plug-in defaults to tilt at 4.5 dB, although, this can be adjusted within the plug-in. The Waves’ display looks like it’s using the same sort of banding as Smaart, although, my guess is the resolution at low frequencies is not as detailed.
Personally, when I’m using an RTA for mixing purposes I prefer an RTA that displays pink noise as flat. The flat measurement may not be technically correct, but it correlates to what I think it should be based on my perception and since I’m primarily using my ears to listen while mixing I like the visuals to match my perception. This is why the ability to flatten out a pink noise measurement exists in the first place.
Now, allow me to complicate this even further. If we play pink noise through a PA and stick up a measurement mic, pink noise from a “flat” PA measured in Smaart’s RTA would probably look more like the Blue Cat and Izotope measurements. I don’t think I can say exactly why that is from a scientific perspective, but an educated guess is it’s probably a combination of air absorption and room acoustic reverberation clouding the measurement. A transfer function in Smaart would then look completely different from that. Needless to say, it’s another reason why RTA’s aren’t the best tool for PA optimization and also why I often route the cue buss from a console into a channel of Smaart’s RTA.
So, maybe you’re thinking right now that none of this analyzer stuff is as easy as you’d hoped it would be. I would love it if sound was a video-game where we can take some measurements and tweak things to make it look pretty, and then it would all sound great. But it doesn’t work that way.
So what’s the real takeaway I think you should get from this?
You need to understand how your analyzer is displaying information if you’re going to effectively use it. Use your ears first and foremost and analyzers to help verify and/or fine-tune things. Simply adding an RTA to your toolset isn’t a shortcut to learning how to do things by ear. Make sure you learn and understand exactly how your RTA works and what you’re seeing before you try putting it to full use.
This is one of the ideas I get into on the workshop I have for using measurements for mixing. If you’d like to find out more about the workshops I offer, you can click HERE to get a list.
 Next Post