Aiming for a Target
So, as some of you know I made a conscious decision to stop handing out SPL numbers a couple of years ago. You can go back and read the original post if you missed it, but the gist of it is that loudness is a perception and a lot more complicated than a single number. SPL measurements don’t offer any information on frequency balance which is a critical component of our perceived loudness. It’s not bad to keep an eye on SPL, but I think if there’s something you should really be monitoring, it’s frequency balance and level.
A couple years ago I took a mix that I considered to have a frequency balance that could serve as a benchmark for me to do this. I typically run Smaart’s RTA Averaging at either 5 or 10 seconds. I played back the mix at show level until I had a decent averaged measurement displayed and stored a trace. The beauty of this kind of measurement is not only does it show frequency balance, it shows the preferred level of that balance because I have the RTA set to plot a calibrated level.
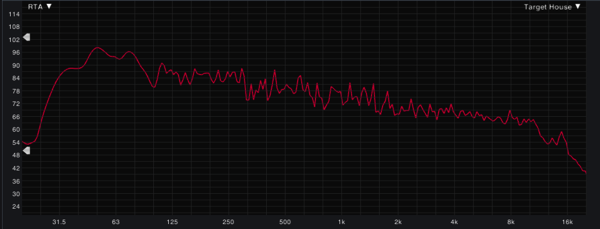
I’ve used that trace on a regular basis since then to check my mixes for weekly consistency. The only challenge with this, though, is that since it’s a measurement trace it’s not the prettiest thing to look at. You can see the measurement below displayed at 1/24th octave banding.

Reference Mix Measurement
While I prefer less averaging across the spectrum on live measurements, when I’m using something as a target, I have always wanted to have something that was a little cleaner to look at because once you start overlaying a lot of messy measurements and traces, it gets harder for me to see what I’m really measuring against each other.
I guess I’m not the only one who desired a way to have cleaner targets to look at because Rational Acoustics released an update to Smaart this week that makes this a whole lot easier. RA calls them Target Curves. Now we can overlay a Target Curve in the foreground on Smaart’s RTA. I’ve always wanted to draw a straight line through my target measurement from 2 years ago, and with Target Curves now I can do just that.
Here’s my new Target Curve(purple) displayed against my original measurement(red). Note how it pretty much cuts right through the middle of my original measurement.

Target Curve with Reference Mix
First, I took my original measurement and set Smaart’s banding to 1/3 octave so I could get a baseline decibel level and figure out the trend for my mix. What I found is that my personal preference is for a frequency balance that drops about 4 dB per octave across the listening spectrum. I originally thought 3 dB per octave was the magic number, but that ended up too shallow. Go figure.
The next step was to place the data into a curve file Smaart can read. You can find out more info on Smaart’s curve files and how to format them in Smaart’s Help section within the software. They’re basically text files with tab deliminated data, but I just downloaded some curves from the RA site and modified one with my data. I picked a frequency like 500 Hz, looked at the dB level in my original measurement, and then just added or subtracted 4 dB from that level for the other octaves. The photo below shows my original measurement with 1/3 octave banding along with my new target curve overlaid to display the result. Based on this averaging I might end up tweaking my target so that it’s up a dB or so, but in the meantime I’m going to go with what I’ve got.

Mix Reference @ 1/3 Octave Banding
NOTE: that this is NOT for use in tuning the PA.
[Sorry, the target curve is no longer available.]
As you can see from the screen shots above, this target was based on an actual mix and is basically where I put the louder music portions on a Sunday morning these days. In other words, this target is how loud I currently mix on a Sunday. Of course, your mileage with this particular target curve may vary depending on your own tastes and the tastes of the people you mix for, music style, etc. For example, I would guess that in a smaller room, this might be perceptually much louder than in our spaces.
If you’re going to use a target, though, you should probably make your own target curve based on your own personal needs for where you’re mixing. However, after years of looking at measurements of both live and studio mixes, the one thing I can say that you’ll probably want with this is some sort of straight or straight-ish line because a great mix typically features a great balance across the entire frequency spectrum. That doesn’t mean there aren’t times when you stray from that, but this is just what I’ve found seems to make most people happy.
Now, let me leave you with a tip to consider when using targets while mixing.
Targets are great, in my opinion, and far better than a simple SPL reading, but they’re just targets. You shouldn’t be nickel and dime’ing a mix with these. Targets are simply a visual reference you can check when you are hearing something that seems off.
Did you get that?
You LISTEN first, and then you can look if you need/want to. Ears always come first. If you do end up looking, you should be looking for a trend. Here’s my measurement photo along with the target one last time:
One last thing to keep in mind when using these is that hitting your target still doesn’t mean your mix is any good. All a target show us is the overall relative frequency balance. A target says nothing about the musicality of the actual mix. Only an ear is going to tell you if it sounds like music. You still have to put all the instruments in the right place within that spectrum.
If you’re a Smaart user and interested in this sort of thing, be sure and check out the new Target Curve feature in v7.5. If you’re using a different RTA I’d highly suggest checking to see if there’s a similar feature available to you. References can be a powerful tool for mixing.
 Previous Post
 Next Post