Slope Analysis

I’ve gone back and forth on using RTA’s and other measurement gear while mixing. Measurements can be great tools, but it’s easy to turn them into a crutch. On the other hand, I’ve had an RTA come in pretty handy lately so I thought I’d talk about how I make use of one.
I use Smaart 7 for all of my audio measurement needs these days. I believe the true power of Smaart lies in its transfer function and the windowing it employs, but I find transfer function to be typically more useful as a system optimization tool. I make more use of the RTA and Spectragraph when mixing, but today I’ll focus specifically on the RTA.
RTA’s are fairly prevalent these days–you can even get them for your smartphone–but for those new to them RTA stands for Real Time Analyzer. An RTA is basically a display of the frequency content of an audio signal presented in real time. The signal can come from any source, but I primarily use a measurement microphone or a feed from my console. The strength in using a measurement mic with an RTA this way is you can get a visual reference of what you’re hearing in the room regardless of how the system is setup, and at the end of the day what it actually sounds like is what makes everyone happy.
The problem I’ve had with RTA’s in the past is they often look a lot cooler than they are useful. With an RTA running in real time, it reads as a bunch of lines jumping around on the screen. It looks cool and I guess you can get some info from it, but I personally find it hard to interpret the data.
At some point over the last couple years, however, I started employing a tip from Dave Rat and slowed the averaging of my RTA. As Dave explains it, this is better because our ears are more sensitive over time. An instantaneous moment of harshness doesn’t bother us, but a constant drilling will. So I started setting my averaging to 5 or 10 seconds, and the result was a better overview of the overall spectral balance of the mix in the room.
Information is worthless, however, if there’s no way to apply it. This RTA data becomes useful for me when I think I’m hearing something tonally strange because I can often verify my hearing with the measurement. I hope you read that right. I listen first, and look at the measurement second.
Strange might mean I hear a constant resonance, some kind of harshness, or even just an overall sense that something isn’t quite right. When this is the case an RTA helps me confirm my suspicions and hone in on the cause of the problem. It can also be useful when dealing with a cold or allergies to make sure I’m not mixing too bright. However, I don’t mix to the measurement. It is simply a reference. If everyone is happy with the mix because it feels great, I don’t look at the measurement.
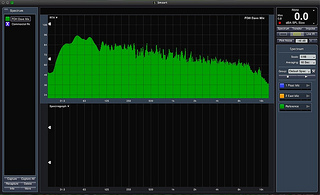
The photo above is a measurement from a Sunday service. This particular screen cap is set to 1/48th octave resolution, but I typically use 1/24th octave in practical usage. I like 1/24th because it’s not super-high resolution; I’m really watching for major trends across the mix and 1/24th is plenty of resolution for that. I also typically display “bars”, although I’ve been starting to play around with the “line” display since it’s easier to read multiple measurements this way for comparison. I leave the dB range at the default setting of 100 dB.
The dB range is often overlooked, but it’s actually quite important when viewing measurements. Different software defaults to different settings, and if you’re zoomed out too much you can easily miss a trend. In fact, if you zoom out far enough, you can probably make a lot of mixes look great. Conversely, zooming in too much might give the wrong impression that something odd is happening. 100 dB gives me enough information to investigate, but not too much info so that I end up nickel and dime’ing the thing.
What I’ve found over time is that our best reviewed mixes exhibit a pretty smooth downward slope moving from low to high frequencies across the entire spectrum. Andrew Stone’s mixes bear the same evidence based on some screencaps he posted over at the Church on the Move blog.
How much slope is right will depend on taste and overall mix level. The shallower or flatter the slope, the brighter the mix can get at higher volumes. For example, I’d guess that Andrew Stone’s mixes at COTM are a little darker than mine based on the screencaps he posted and knowing we are running similar SPL levels. There’s nothing wrong with that because you always need to figure out your own tastes. One way or the other, I’ve found that a smoother overall frequency slope typically represents a balanced mix. Dave Rat has mentioned he looks for a slope that descends at a rate of 1 to 3 dB per octave which would probably be a little bright for my tastes based on my experiences with this. My measurement represents a 3 to 5 dB per octave drop which I like as a nice balance between warmth and clarity. Do keep in mind this is for a full band, though. Stripped down instrumentation, videos, and people speaking aren’t necessarily going to measure as evenly.
If you’re having difficulty seeing the slope, you can see it clearer when I change the scale settings to lower resolutions and more averaging takes place. The screenshots below are varying resolutions of the same measurement as above:

1/24th Octave Scale

1/6th Octave Scale

1 Octave Scale
While an RTA can be a great tool, it’s also important to understand what an RTA won’t tell you. An RTA won’t tell you if you can hear all the instruments in the mix. It won’t tell you if the kick drum is too loud. It won’t tell you if the guitars and keyboards are stepping on each other. It won’t tell you if the vocals are clear. And maybe most importantly, an RTA won’t tell you if the mix is good. I can turn pink noise on and make it look like these screencaps, but that doesn’t mean people want to show up and listen to it.
I’ll wrap this up with one last thing. The screenshot below is a measurement I took of a commercially released CD. The specific recording isn’t important because I looked at several, and they all looked similar to this:

Commercial Recording
Notice the slope of the commercial recording measurement and how relatively flat it is. You might also notice that it is somewhat similar in consistency to the slope of my mix measurement done in my room.
Now think back to my Harsh Reality series of posts. Perhaps you’re wondering what would happen if we could take my mix and tilt its slope a bit to more closely match the commercial recording, spit out an MP3 of it, and listen to it in the car.
Now maybe you’re thinking about your own mix. You’re happy with it in the room, and it has a consistent frequency balance. Now maybe you’re wondering what would happen if you put an RTA directly on the output of your console and measured your own mix. That makes you wonder what would happen if you could tilt or shape your mix’s slope to look like a commercial recording and spit it out to a CD or MP3 or webcast or whatever someone comes up with next. The results might be interesting….


Hi Dave,
So do you tune your system to help provide the downward sloped response?
In other words, if you input a CD with the “flatter” response (hinge point not until ~4k), does the transfer function you’ve created with your DSP cause it come out with the enhanced downward slope?
Good question, Steve. I do and I don’t. The sound in the room is always my first priority, and I’ve found that the less EQ I put on a PA, the better it sounds. At the same time, the number of low drivers in the system typically help with this naturally. So my system is typically linear from about 200 Hz and up. Below 200 Hz it starts to rise into a really big bump in the sub band that I don’t typically completely fix.
I’m going to try and do a followup post on this, Steve.
I’ve been doing something similar with recordings at a mastering stage. Recently I’ve then applied it to a live situation with good results.
I take the peak levels because I use the hold function of the rta. Based on the range from a direct feed of about 10 commercially produced tracks which my rta can display in the background I can easily see if it needs more overall highs or a bit extra subs etc. However you need to make sure that from the out of your mixer through to the ears in the auditorium is setup right. I’m finding it very useful as our mixing desk location has some serious subbass nodes and the usual kinda of anomalies that come from having a mixing desk at the far back of the room in a location somewhat different to everyone else in the auditorium.